Hiding Call To Ptrace
Ptrace (process trace) is how a program can gain control of another program on Linux. It is commonly used by a debugger or a tracing program to attach and probe into another program’s execution state. As seen below, both gdb and strace contain ptrace in their dynamic symbol table:
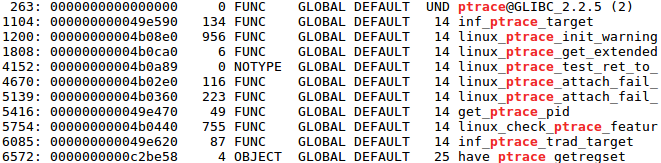
Figure 1: readelf --dyn-syms /usr/bin/gdb | grep ptrace

Figure 2: readelf --dyn-syms /usr/bin/strace | grep ptrace
But aside from its normal usage, ptrace can also be used as a debugging deterrent. If a user program contains a ptrace call to trace itself, the call to ptrace in that user program will fail (return -1) if another program like gdb already used ptrace to attach to it. A simple example of the technique can be seen below:
#include<stdio.h>
#include<stdlib.h>
#include<sys/ptrace.h>

int main(){
    if (ptrace(PTRACE_TRACEME,0) < 0) {
        puts("being traced");
	exit(1);
    }
    puts("not being traced");

    return 0;
}
Example Code #1
gcc -o [binary] [source]
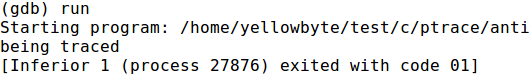
Figure 3: output from running the compiled version of the above code in gdb
Reviving Ptrace For Anti-Debugging
The goal of this post is to make ptrace a practical solution for anti-debugging. I am not sure about you but ptrace is the first anti-debugging technique I have learned. In fact, it is the first anti- anything that I have came across. The use of it as a debugging deterrent is well known to say the least. But that is not the main reason why you don’t see it outside of a simple reversing challenge. Other anti-reversing technique such as code virtualization has also been known for a while but is still a relevant technique used in commercial software product to deter people from reversing it. What distinguishes anti-debugging with ptrace from code virtualization is how easy it is to identify and bypass the former. For example, if a binary uses ptrace, it will show up in the import table of any modern disassembler like IDA Pro and Binary Ninja (Figure 4). And once you identified it, it is also really easy to bypass it by NOP-ing the call (Figure 5).
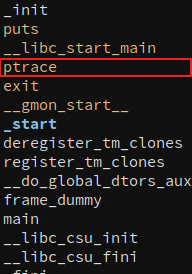
Figure 4: Binary Ninja's import table showing usage of ptrace
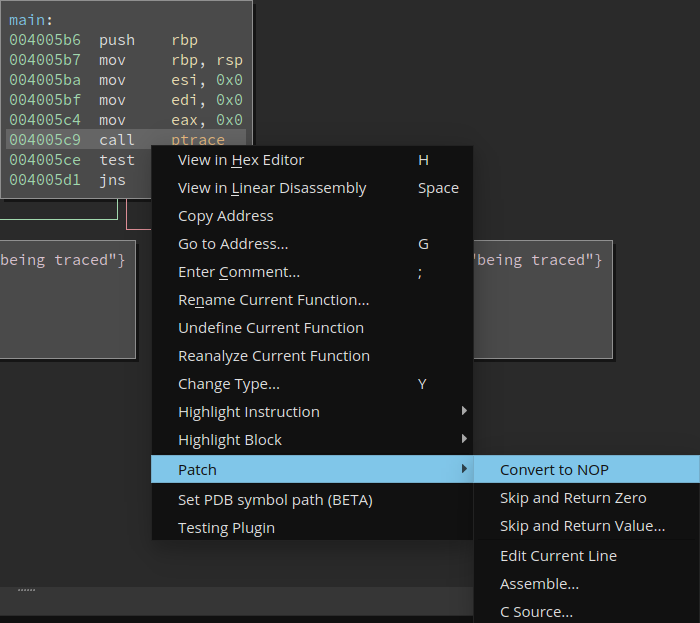
Figure 5: Using Binary Ninja to NOP function call
Even without fancy tool like Binary Ninja, you can still patch it with any hex editor. There are other ways to bypass ptrace too. For example, another popular method is preloading with either LD_PRELOAD or /etc/ld.so.preload.
LD_PRELOAD is an environment variable that can contain paths to shared libraries, and if it does, the dynamic loader will load them before other shared libraries. /etc/ld.so.preload can also be used to achieve the same effect except that it is a file. For more information on their differences check out this post. Essentially, preloading with either LD_PRELOAD or /etc/ld.so.preload allows us to bypass ptrace since we can set our own implementation of ptrace to be ran instead.
Approach
No one in their right mind will want to reverse engineer a binary from file offset 0 to the last byte. We always want to narrow down the scope of manual analysis. But even more importantly, we want to identify interesting locations to start reversing from since unless we can narrow down the scope to just a few short functions, just narrowing it down is not enough.
A thorough initial assessment can help us identify locations of interest. Examples of locations of interest are sites where anti-debugging techniques are applied. Defeating them early on will help expedite the manual reversing process. For example, if all the debugging deterrents are patched up, your debugging session will have higher fidelity to the actual execution of the binary, thus conclusions drawn from the debugging session will be more trustworthy.
The main problems with ptrace as a practical anti-debugging solution are that it is easy to identify and easy to bypass. A simple and superficial initial assessment, like looking at the import table for interesting functions, will be sufficient enough to identify usage of ptrace. The fact that ptrace is easy to bypass cannot be helped; it’s just a function call. But it is possible to make ptrace more inconspicuous such that initial assessment will not be able to pick up ptrace’s presence.
Beside slowing down a reverser through intricate obfuscation means, we can also slow a reverser down by giving him or her as little hints as possible on where to start reversing from
The rest of this article will focus on how to make ptrace harder to identify. In summary, I will talk about how to make ptrace as stealthy as possible from commonly used initial assessment tools.
Leveraging Compiler Flags
The most obvious sign of ptrace from Example Code #1 is that ptrace will show up in the import table. Let’s see if we can remove ptrace from it.
Compiler such as GCC (GNU Compiler Collection) provides us with various flags to control a compiler’s implementation-specific behavior, which in turns allows us to tailor specific properties of the target binary; maybe there’s a flag or a combination of them that will remove ptrace from the import table.
The most obvious one to try is the -s (strip) flag. Compiling with this flag option will strip away the symbols table and in essence ptrace is really just a symbol, a name for an address. But from Figure 6, we see that symbol for ptrace did not get stripped away. Why is that? Did we find a bug in the compiler? Fortunately, no. We actually did strip away the symbol table, but only the symbol table in the .symtab section and not the one in the .dynsym section. The .symtab section contains all the symbols in the binary (symbols needed for both linking and runtime execution) while the .dynsym section contains only symbols required for runtime. This blog post explains well as to why there are two symbol tables so I won’t explain it here.
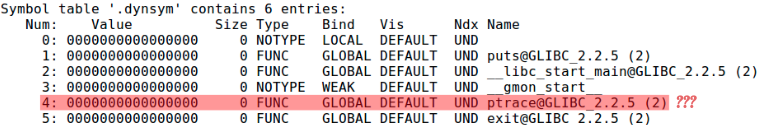
Figure 6: gcc -s -o [binary] [source] && readelf --symbols ./[binary]
The reason that we can’t strip away the symbol for ptrace is because it is in the .dynsym section and symbols in the .dynsym sections are not resolved until runtime. In fact, it won’t be resolved until the first instance of ptrace is called due to library functions’ lazy binding. This is why, as seen in Figure 7, the address for ptrace symbol is 0 while the other symbols like main and _start have a resolved address. And to prove to you that the first column of Figure 7 is the address pointing to the start of those symbols, if you look at Figure 8 you can see that the address of function _start’s first instruction corresponds to the value shown in Figure 7’s first column.
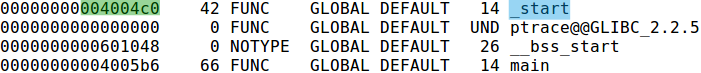
Figure 7: portion of output from `readelf --symbols [binary]`
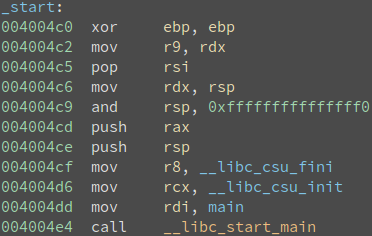
Figure 8: start function of the binary used in Figure 7
If we can’t strip ptrace’s symbol because it is a function in a dynamically-linked library, why not statically link the dependent library instead? This way, the symbol for ptrace will be resolved during compile-time and we will be able to strip it away. We can use -static flag in gcc to tell it to statically link glibc, which contains ptrace’s implementation (Figure 9).

Figure 9: gcc -static -o [binary] [source] -Wl,--verbose | grep ptrace -A1 -B1
And if we statically link and strip our binary, we get exactly what we wanted:
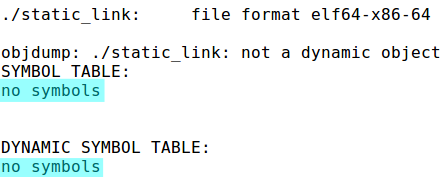
Figure 10: gcc -static -s -o [binary] [source] && objdump --syms --dynamic-syms ./[binary]
Now ptrace will no longer show up in the import table and is perfectly hidden. Or is it…?
It’s true that ptrace will no longer show up in the import table, but that rings true for all other glibc functions your code uses as well. Seeing an empty or near empty import table is also useful knowledge to a reverser. It tells him or her that the binary is statically-linked or some sort of obfuscation is at play. Either way, it screams to a reverser: figure out what library functions are hidden! And with the help of IDA FLIRT, it won’t take long before a reverser figures out that ptrace is being used. You can leverage Binary Ninja’s Nampa to apply FLIRT signatures on a binary to identify statically-linked library functions.
Packing
What if we apply a packer to a stripped statically-linked binary as seen below? IDA FlIRT will definitely not help the reverser in this case:
$ gcc -static -s -o [binary] [source]
$ upx -o [packed_binary] [binary] # Using UPX packer
Problem with packing is that the usage of it is too obvious (Figure 11,12). The use of packer is a huge red flag that something is being hidden. Bypassing ptrace will be easy once discovered so we want our usage of ptrace to be as stealthy as possible. Also, commonly used packer such as UPX is easily identifiable by tools like PEiD. Unless you are using a custom packer that is hard to unpack, since there are already a myriad of information on unpacking packed programs, it won’t take long before a reverser successfully retrieves the unpacked image.
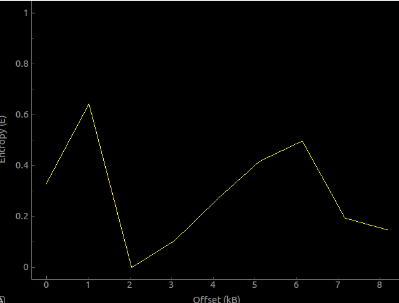
Figure 11: binary's entropy graph before packing (Binwalk -E [binary])
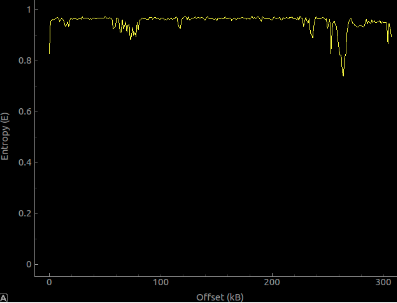
Figure 12: binary's entropy graph after packing (Binwalk -E [binary])
Dynamic Loading
Dynamic loading refers to the concept of loading a library and retrieving library function addresses during runtime. Since address resolution is done during runtime, ptrace will not show up in the import table. Code Example #2 shows a ptrace implementation of it. To accomplish this, we need dlopen to load the library and dlsym to resolve function address.
#include <stdlib.h>
#include <stdio.h>
#include<sys/ptrace.h>
#include <dlfcn.h>
#include <string.h>

int main(int argc, char **argv) {
    void *handle;
    long (*go)(enum __ptrace_request request, pid_t pid);

    // get a handle to the library that contains 'ptrace'
    handle = dlopen ("/lib/x86_64-linux-gnu/libc.so.6", RTLD_LAZY);

    // reference to the dynamically-resolved function 'ptrace'
    go = dlsym(handle, "ptrace");

    if (go(PTRACE_TRACEME, 0) < 0) {
        puts("being traced");
	exit(1);
    }

    puts("not being traced");

    // cleanup
    dlclose(handle);

    return 0;
}
Example Code #2
gcc -o [binary] [source] -ldl
As suspected, ptrace is no longer in the import table:
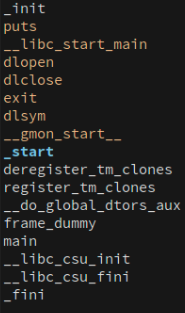
Figure 13: Compiled code of example above's import table in Binary Ninja
wait a second…
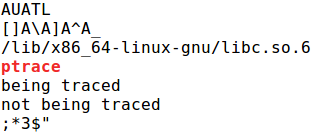
Figure 14: gcc -o [binary] [source] -ldl && strings [binary] | grep -A3 -B3 ptrace
Although ptrace doesn’t shows up in the import table, it’s shows up when you run GNU strings on the binary. This is not any better…
The reason it shows up in GNU strings is because the second argument to dlsym, the string “ptrace”, will be placed in the .data section after compilation. To make gcc not place the “ptrace” string in the .data section, we can simply make it into a character array as seen in Code Example #3:
#include <stdlib.h>
#include <stdio.h>
#include<sys/ptrace.h>
#include <dlfcn.h>
#include <string.h>

int main(int argc, char **argv) {
    void *handle;
    long (*go)(enum __ptrace_request request, pid_t pid);
    char haha[] = "ptrace";

    // get a handle to the library that contains 'ptrace'
    handle = dlopen ("/lib/x86_64-linux-gnu/libc.so.6", RTLD_LAZY);

    // reference to the dynamically-resolved function 'ptrace'
    go = dlsym(handle, haha);
    ...
}
Example Code #3
how to compile: gcc -o [binary] [source] -ldl
This way the string for “ptrace” will be constructed on the stack during runtime:
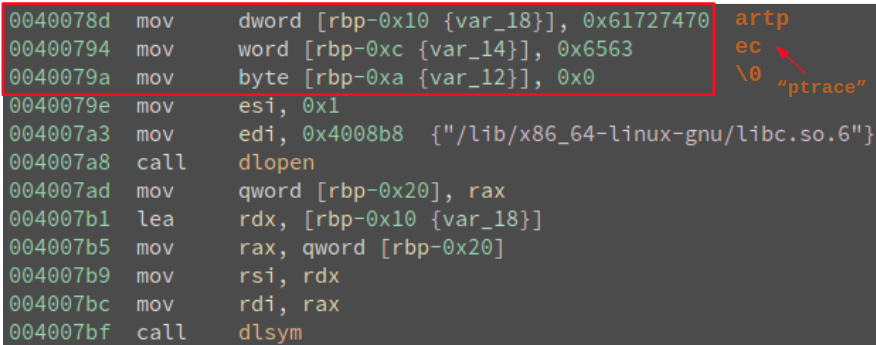
Figure 15: Hiding "ptrace" string on the stack
Another approach will be to store the encoded string in the .data section and decode it during runtime:
...

// each character in 'osq`bd' plus 1 in ascii is 'ptrace'
char *encoded = "osq`bd";
int encoded_length = strlen(encoded);
char *decoded = (char*)malloc((encoded_length+1) * sizeof(char));
for (int i = 0; i < encoded_length; i++){
    decoded[i] = encoded[i]+1;
}
*decoded += '\0';

...
Example Code #4
The main drawback to using dynamic loading to hide ptrace call has nothing to do with the fact that we need to manually hide string reference to ptrace, rather it has to do with the fact that we are using dynamic loading. With dynamic loading, dlopen and dlsym still need to be in the import table and this hints at reverser that there are library functions that are dynamically resolved. Like packing and static linking, this screams at the reverser to figure out what those hidden functions are.
System Calls
There is actually a system call for ptrace as seen in Figure 16. So instead of using the library wrapper for ptrace, we can directly access it by calling the ptrace system call.
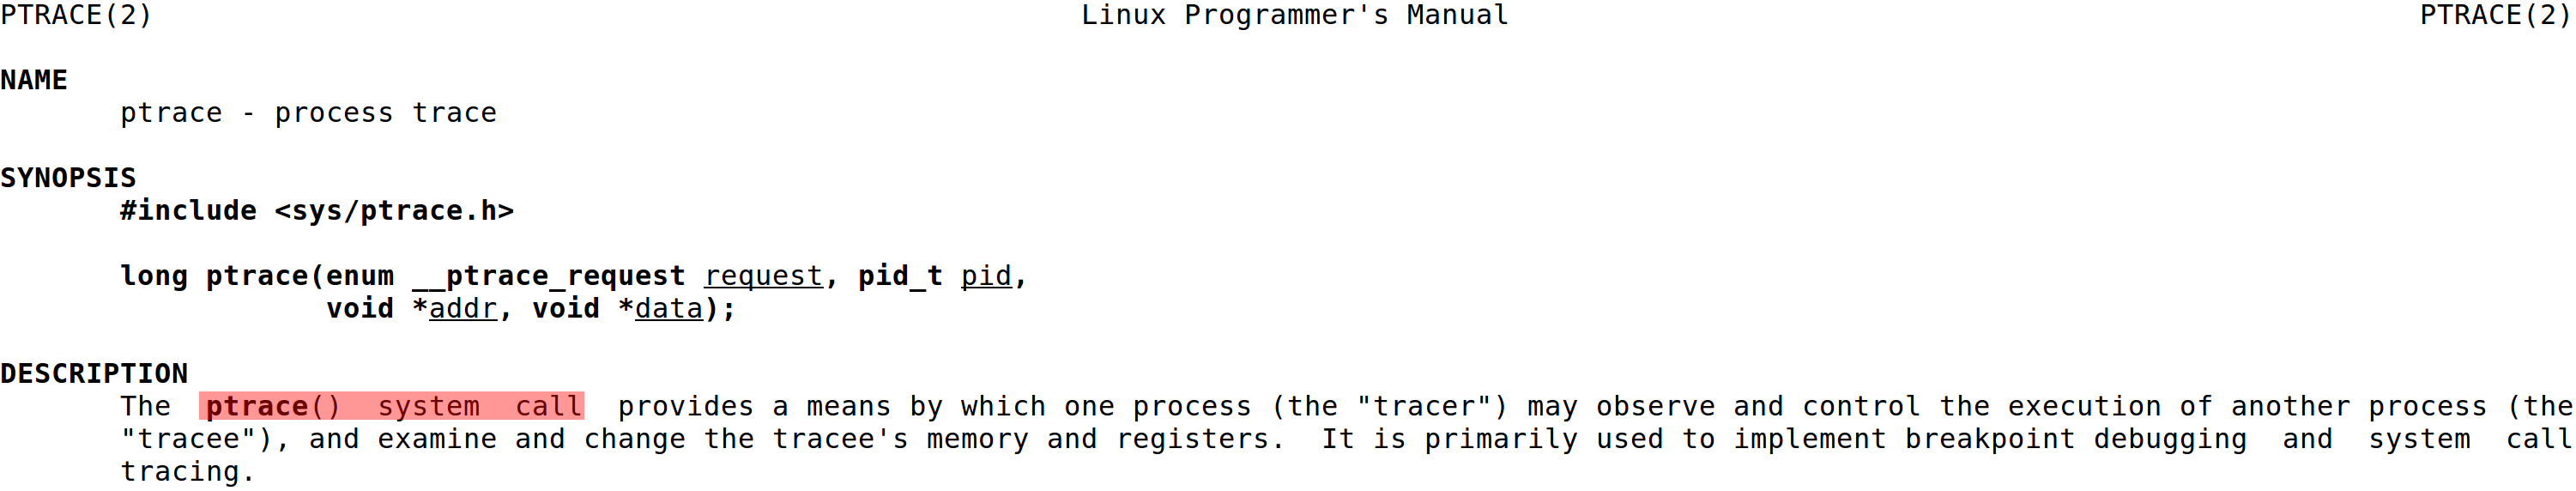
Figure 16: man ptrace
Example Code #5 is a semantically equivalent Example Code #1 source in x86 assembly. A bit of explanation: ‘int 0x80’ is one way to make system call for 32-bit Linux executable. System call number is placed in EAX register while the first 6 arguments are placed in EBX, ECX, EDX, ESI, EDI, and EBP, respectively. To see the system call table for ‘int 0x80’, click here. Like Example Code #1, the binary compiled from Example Code #5 will print “being traced” to the console if it’s running under the context of a debugger or print “not being traced” if it’s not. Note that it is not necessary to write everything in assembly to use the ptrace system call. I could have written the example in C and used inline-assembly to call ptrace instead.
global _start

section .text

_start:
    ; calling ptrace
    mov ebx, 0x0
    mov ecx, 0x0
    mov edx, 0x0
    mov eax, 0x1a
    int 0x80 ; sys_ptrace
    cmp eax, 0xFFFFFFFF
    jz debuggerDetected

    ; doing malicious stuff
    mov edx, normalLen
    mov ecx, normal ; "not being traced"
    xor ebx, ebx
    mov bl, 0x1
    xor eax, eax
    mov al, 0x4
    int 0x80 ; sys_write

    jmp exitGracefully

debuggerDetected:
    ; not doing malicious stuff
    mov edx, tracedLen
    mov ecx, traced ; "being traced"
    xor ebx, ebx
    mov bl, 0x1
    xor eax, eax
    mov al, 0x4
    int 0x80 ; sys_write

exitGracefully:
    xor eax, eax
    mov al, 0x1
    xor ebx, ebx
    int 0x80 ; sys_exit

section .data

    traced: db "being traced", 0xA
    tracedLen equ $-traced
    normal: db "not being traced", 0xA
    normalLen equ $-normal
Example Code #5
nasm -f elf32 -o [object file] [assembly source]
ld -m elf_i386 -o [binary] [object file]
By using system call to invoke ptrace, there will be no remnant of ptrace in the import table or in the output of GNU strings!
But is it stealthy enough though?
Functions provided by GNU C Library (glibc) have a much cleaner and easier-to-use interface than directly accessing the available system calls in the Linux kernel. In fact, many glibc functions are wrappers around system calls (Figure 17) so directly using system call in user code is somewhat suspicious. Once a reverser recognizes the assembly instruction corresponding to system call, his or her’s first instinct should be to figure out what system call is being made — and that wouldn’t be hard at all by inspecting the value assigned to EAX register before executing the system call instruction. This process can also be automated. In fact, someone made a plugin for Binary Ninja to do just that: identifying what system calls are made in a binary.
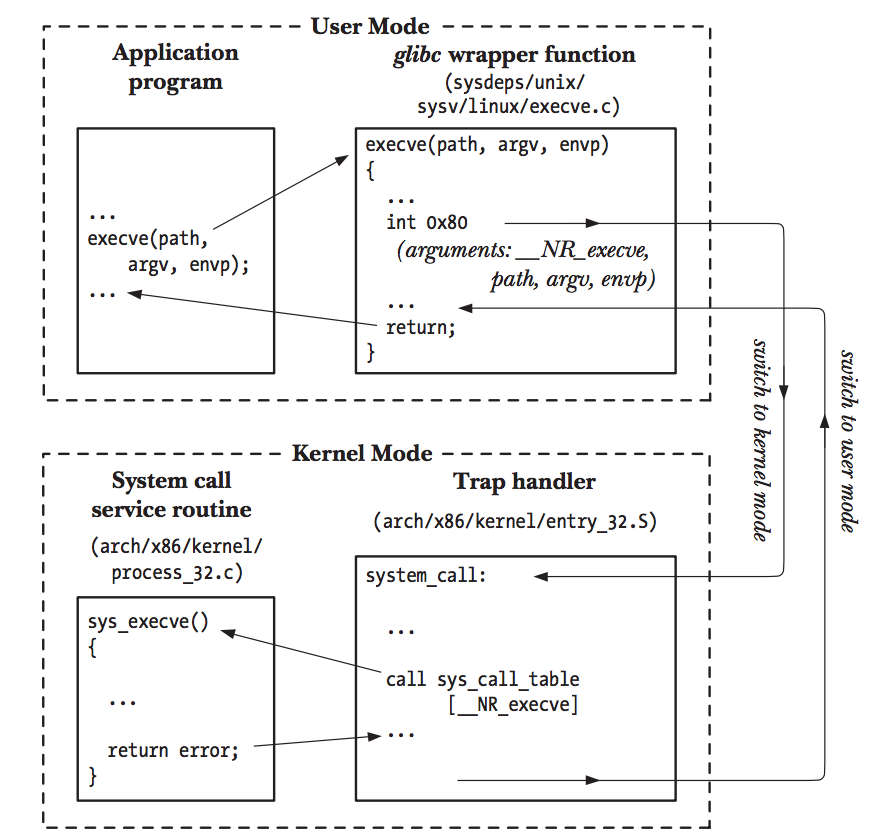
Figure 17: library function call chain
Photo courtesy of The Linux Programming Interface, Chapter 3
Self-Modifying Code
Overall the last attempt did a good job hiding the call to ptrace, with its only drawback being the ease of identifying system call instruction. To build on top of our previous work, let’s try to obfuscate the system call instruction, ‘int 0x80’, by making it not show up in the disassembly. This can be done through a technique call “Self-Modifying Code.”
Unlike fancy biology jargons that make no sense to a layman (xeroderma pigmentosum? anyone?), this technique is quite literal to its name: binary’s executable code will alter itself during runtime. Basically, we can have the binary write in the system call instruction during runtime before executing it. This way, on disk, the system call instruction never existed. The system call instruction will only reveal itself during runtime when execution reaches a certain point.
...

_start:
    ; reveal ptrace
    mov edi, systemcall
    mov ax, 0x80cd
    stosw

    ; calling ptrace
    mov ebx, 0x0
    mov ecx, 0x0
    mov edx, 0x0
    mov eax, 0x1a
systemcall:
    xor eax, ebx
    cmp eax, 0
    jl debuggerDetected

...
Example Code #6
nasm -f elf32 -o [object file] [assembly source]
ld -N -m elf_i386 -o [binary] [object file]
The code snippet shown in Example Code #6 is where the code in Example Code #5 needs to be changed in order to hide ptrace’s system call using “Self-Modifying Code.” The stosw (STOre String Word) instruction stores content of AX register into memory pointed to by EDI register. In the code above, ‘0x80cd’ is the opcode corresponding to the system call instruction ‘int 0x80’ so the stosw instruction will overwrite ‘xor eax, ebx’ (also two bytes long) with ‘int 0x80’. A snippet of the resulting disassembly can be seen below:
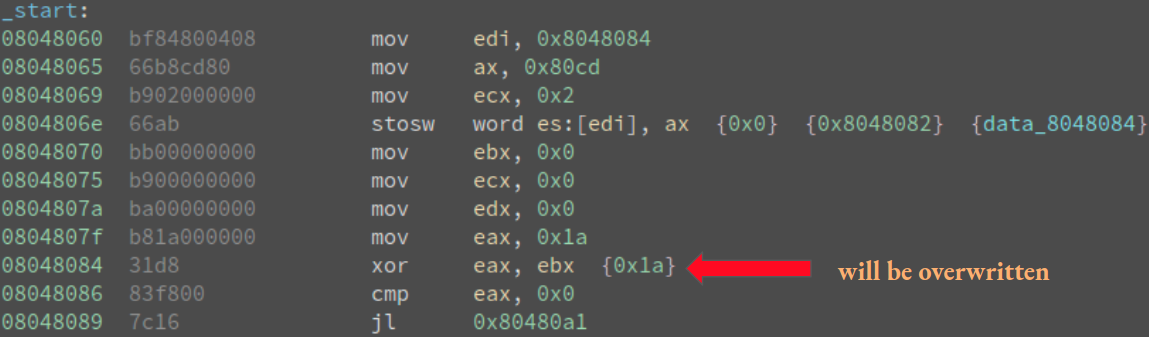
Figure 18: There's no longer any traces of ptrace system call in the disassembly
Note that for this code to work, we need to set .text section (where executable code resides) to be writable. This can be done during the linking phase by passing the -N flag to the ld command like such: ld -N -m elf_i386 -o [binary] [object file].
The permission sets for .text section is encoded into the ELF file and can be easily queried (Figure 19). Unless you explicitly give it writable permission, by default .text section will only have allocate and executable permission. There is really no good benign reason for .text section to be writable and by having it so is also a red flag.
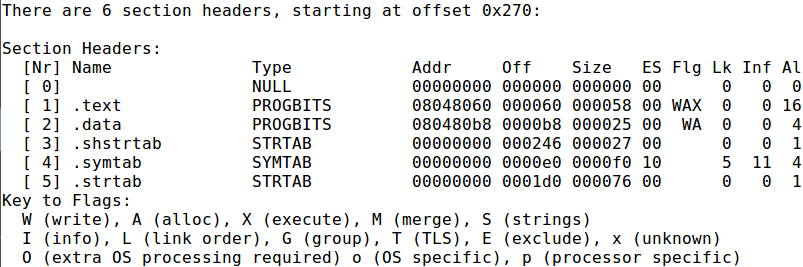
Figure 19: readelf -S [binary]
File Format Hacks
The permission for .text section is encoded in the ELF file format, but is that information required for the loader and program execution? Not everything in an ELF file is required to run the executable. What I mean by that is that you can zero out bytes from an ELF executable and that executable will still run exactly the same as before. So if the bytes representing the permission for .text section are part of the bytes that we can zero out without affecting execution, then we can manually change the permission so that tools like readelf will display incorrect information.
For understanding ELF file layout, the wikipedia page for it is a good start.
Binary file rewriting is easily done with Quarkslab’s LIEF. And looking at the gif below, we see that our suspicion is correct — rewriting the permission of .text doesn’t affect execution at all while readelf now displays .text permission flag as AX (Allocate, eXecute).
Figure 20: binary rewriting made easy with LIEF
Although above approaches conceal ptrace well from initial assessment tools that are static in nature, dynamic initial assessment tools such as strace can still easily detect usage of ptrace:
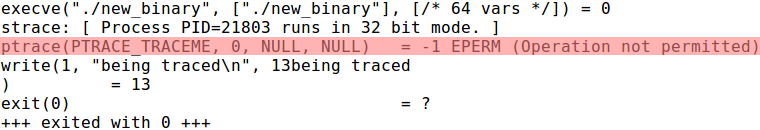
Figure 21: strace [binary]
Conclusion
Below is an example shell session showing what we wanted to happen:
$ ./[binary]
not being traced

$ gdb ./[binary]
being traced

$ strace ./[binary]
being traced
For all our code examples so far, if you haven’t noticed yet, print “not being traced” to the terminal if it’s not running under a debugger or tracer and “being traced” otherwise. In a more practical application, “not being traced” is replaced with activity one’s trying hide from the reverser and “being traced” is replaced with fake activity that one wants the reverser to believe is what the program is doing under real execution.
With just ptrace, although we can achieve the shell session above, we can’t differentiate between gdb and strace. As a result, if we don’t want either strace to discover the activity we are trying to hide or that ptrace is involved, we need something else to uniquely detect usage of strace or a different technique altogether to hide our activity.
Overall the combinations of the approaches above should hide ptrace’s presence pretty well from initial assessment tools. To uncover where ptrace is deployed (if reverser uses strace and discovers usage of ptrace) or why the debugger is not working as expected, we force the reverser to spend more time doing manual reversing. We can make the manual reversing process even harder by applying software hardening or obfuscation. A good overview of software obfuscation can be found in Practical Reverse Engineering, Ch.5.
As for how we can apply software obfuscation to hide ptrace better, the self-modifying portion is a good place to start. Looking back at Example Code #6 that shows the self-modifying code, the system call opcode that is assigned to AX register and the systemcall label that is assigned to EDI register could be the achilles heel that makes all our previous efforts go to waste. When compiled, the systemcall label will transform into an absolute address pointing to where the executable code will be rewritten. That address will be within .text section’s address range. If a reverser is able to take a note of that, he or she will immediately shift their attention to that portion of code and ptrace will be uncovered soon after. So if we want, we can obfuscate system call opcode and systemcall label such that their values are not revealed until runtime. On top of that, a less ad hoc obfuscation technique such as code virtualization or junk code insertion can also be applied to make the overall reversing process a living hell.